Experiment #1 · Anchoring · June 2026
Does the asking price anchor what something is worth to you?
Same camera. Same description. Two different price tags and a $275 gap between them.
$250
Low asking price
G1 avg estimate: $336.77
$131.98
Gap in avg estimates
Same camera, different anchor
$525
High asking price
G2 avg estimate: $468.75
Abstract
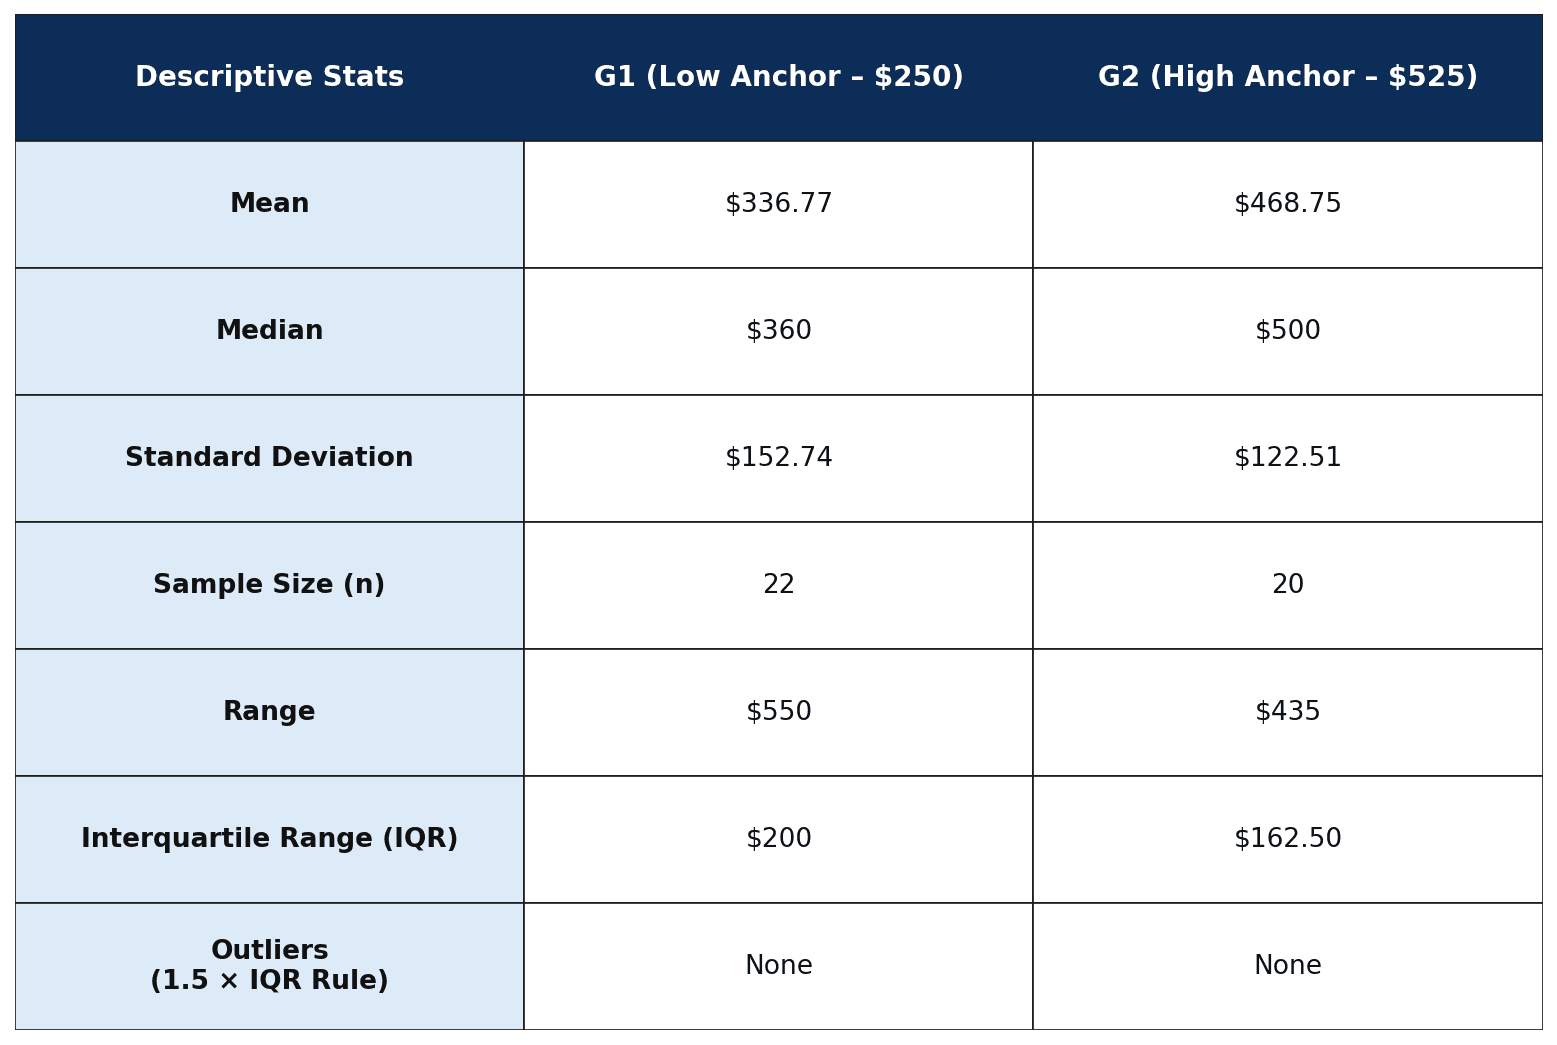
This study examines whether a seller's stated asking price affects what potential buyers value the item at. Forty-two participants were randomly assigned to one of two conditions: a high anchor ($525) or a low anchor ($250). Each participant was given the same description of a used DSLR camera. A two-tailed Welch's independent samples t-test revealed a statistically significant difference in mean fair value estimates between the two groups (t = 3.101, df = 39.42, p = .004), with the high-anchor group reporting a mean of $468.75 compared to $336.77 in the low-anchor group. Effect size was large (Cohen's d = 0.953). These findings are consistent with anchoring theory, suggesting that stated asking prices function as reference points in consumer valuation, even when they carry no objective information about true market value.
Introduction
When someone values something under uncertainty, they rarely start from scratch. Instead, the mind latches onto the first number it encounters and builds an estimate around it, adjusting outward from there, but usually not by enough. This is the anchoring heuristic, first formally identified by Tversky and Kahneman in 1974. They showed that an initial numerical value, even an arbitrary one, can significantly shape subsequent judgment. The mechanism is straightforward: when people lack a reliable basis for knowing what something is worth, the first number they see fills that gap and becomes a reference point they unconsciously anchor to.
Research Question
Does the seller's stated asking price anchor a buyer's perception of fair value?
Hypothesis
Respondents shown a higher anchor will report a higher fair price, on average, than those shown a lower anchor, consistent with Tversky and Kahneman's (1974) anchoring heuristic.
H₀ Null
There is no difference in mean fair-value estimates between groups. μ₁ = μ₂
H₁ Alternative
There is a difference in mean fair value estimates between groups. μ₁ ≠ μ₂
Method
Participants were given a description of a used camera that a fictional seller named David wanted to sell, and were asked to provide what they considered a fair value for it. The following text was shown to every participant:
Try it yourself, flip like participants did:
“What would you pay for this camera? It shoots in full 1080p, handles low light exceptionally well, and produces professional quality photos straight out of the box. David purchased it two years ago for around $800. The camera still performs well, but it's an older model at this point and has a few scratches on the body.”
Your turn. What's a fair price?
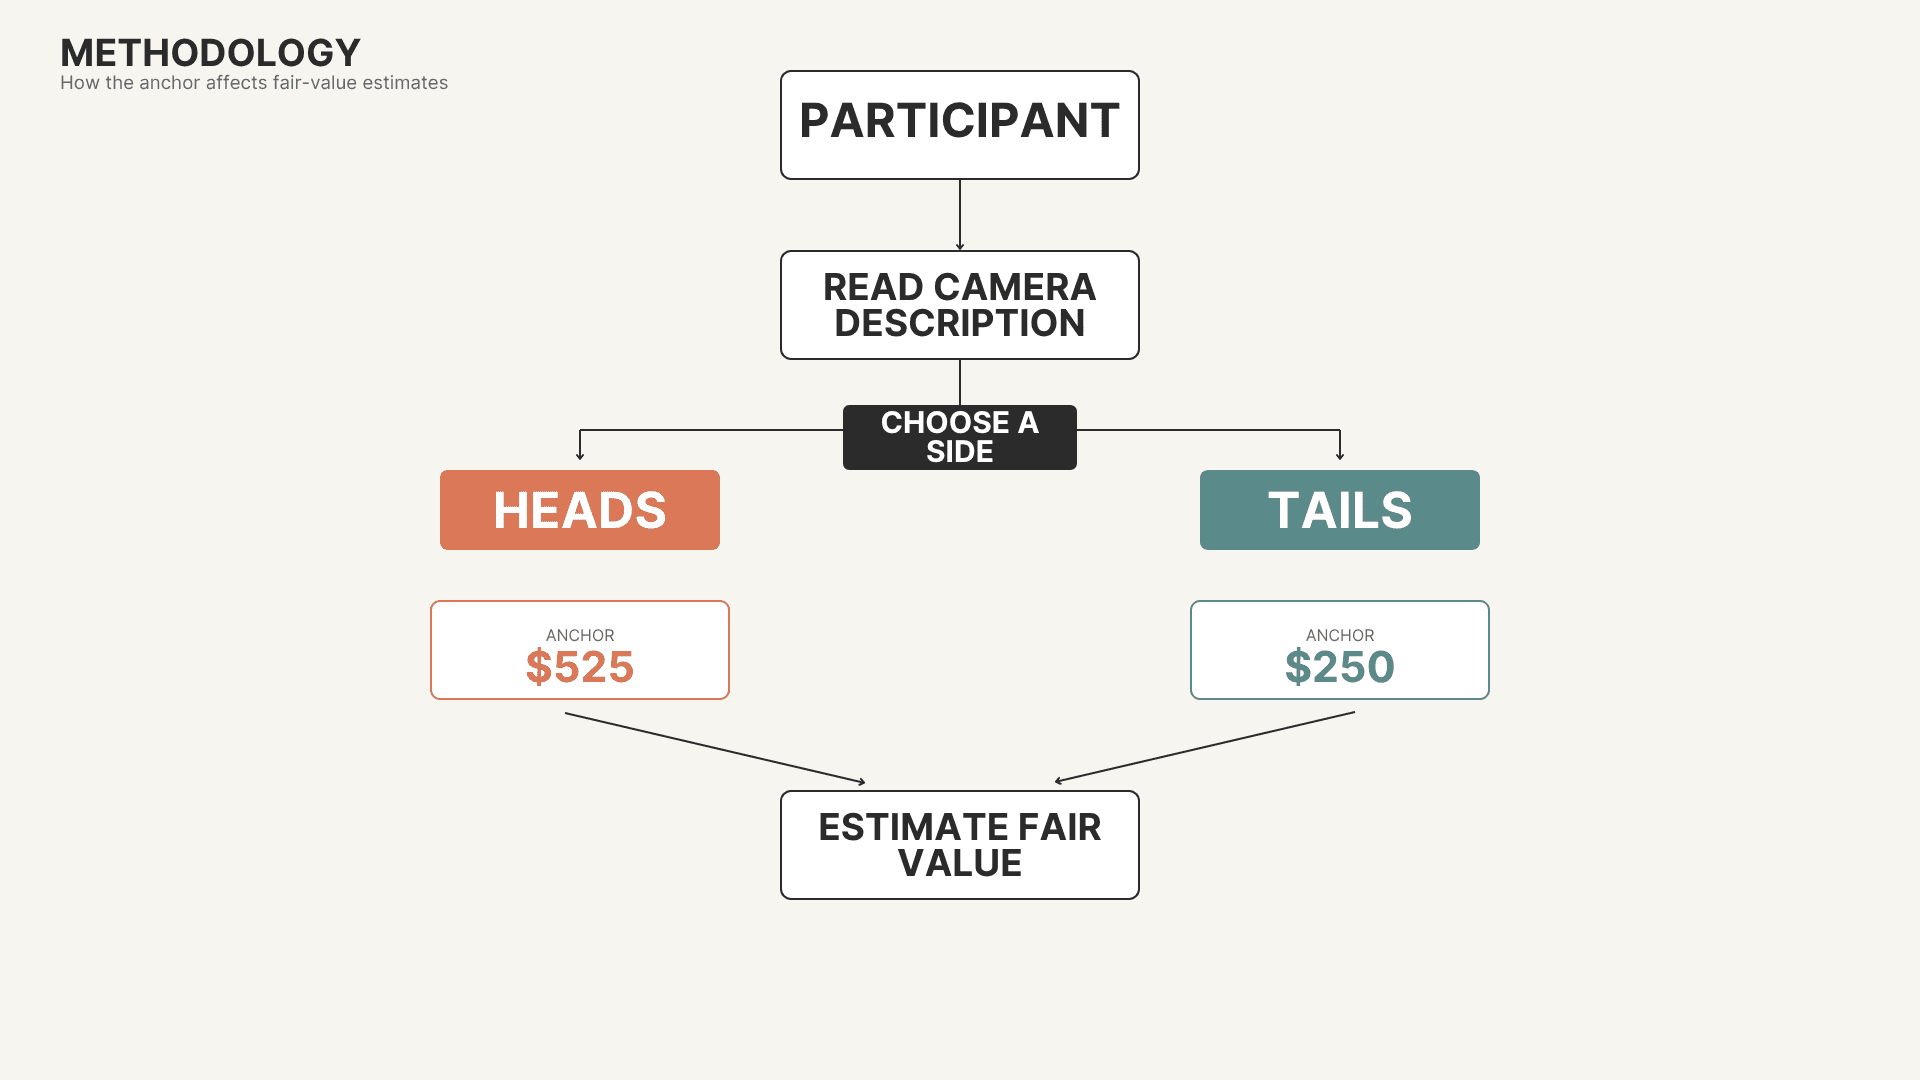
How anchor assignment worked
Results
G1
Low Anchor Group
Shown $250 asking price · n = 22
G2
High Anchor Group
Shown $525 asking price · n = 20
G1 mean
$336.77
Low anchor ($250)
Difference in means
$131.98
G2 minus G1
G2 mean
$468.75
High anchor ($525)
Name: two-tailed Welch's independent samples t-test
Alpha Level: .05Conditions
Click each to check.
Distribution of fair value estimates
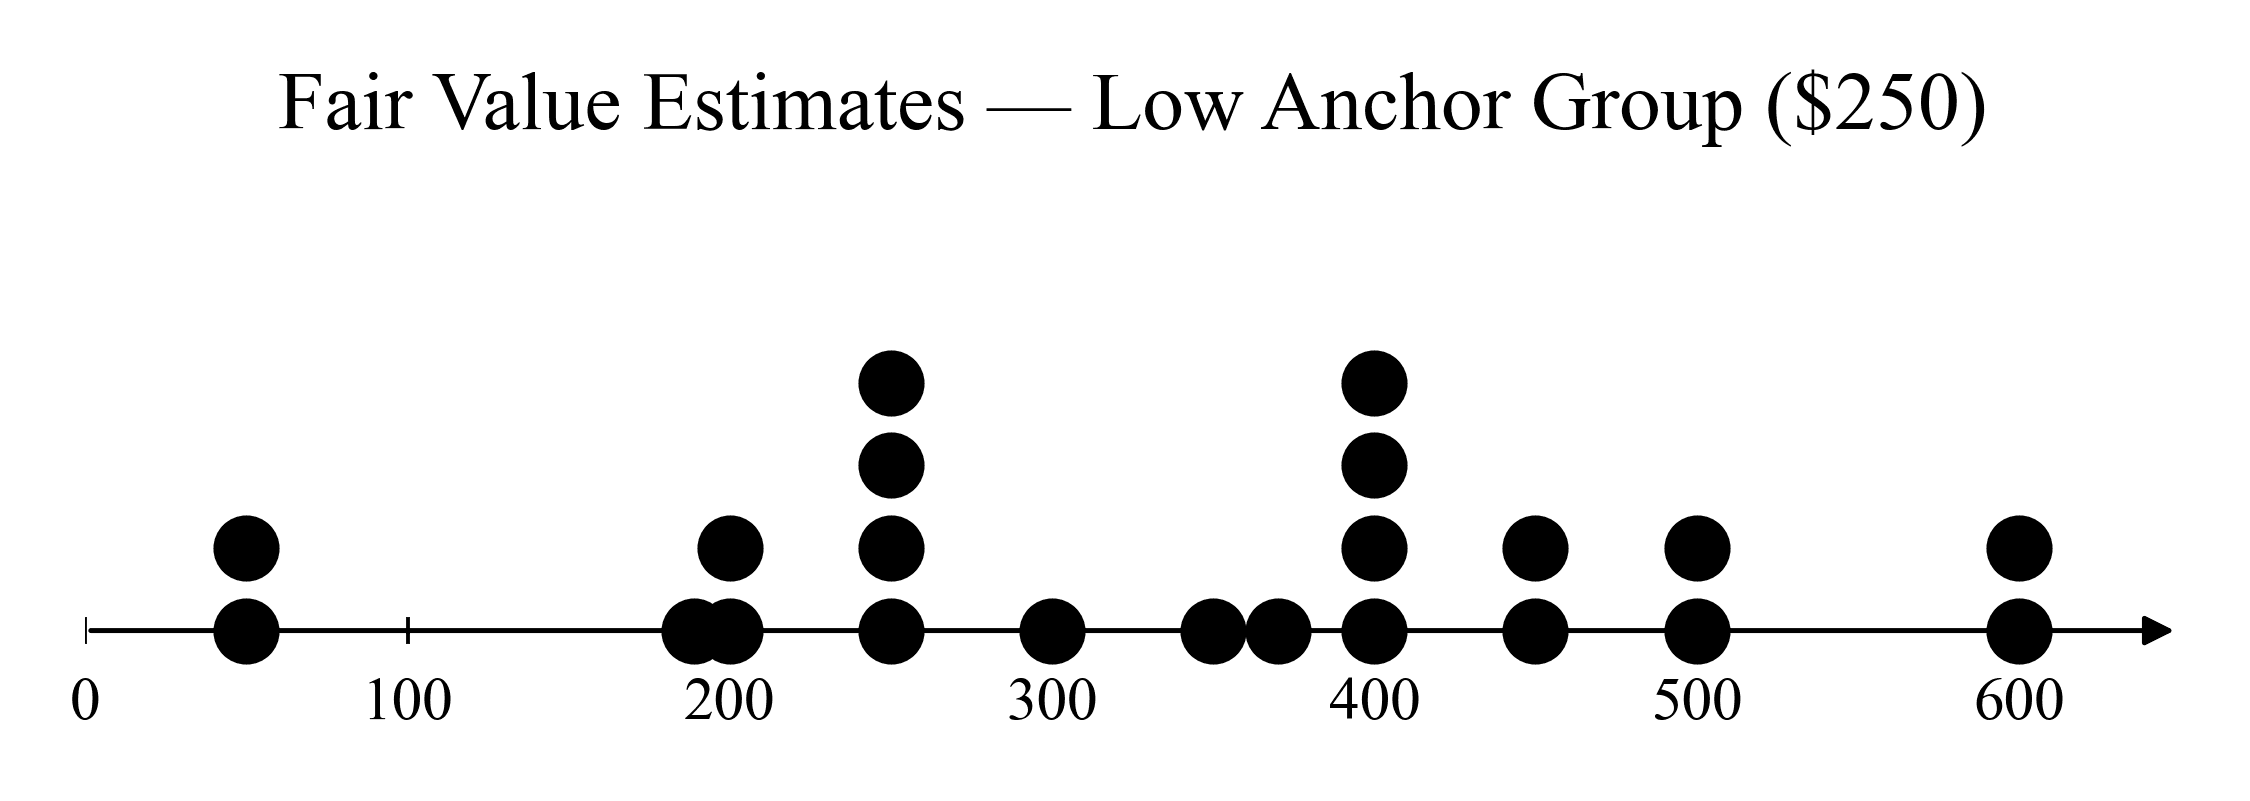
Fair value estimates: G1, Low anchor ($250) · n = 22
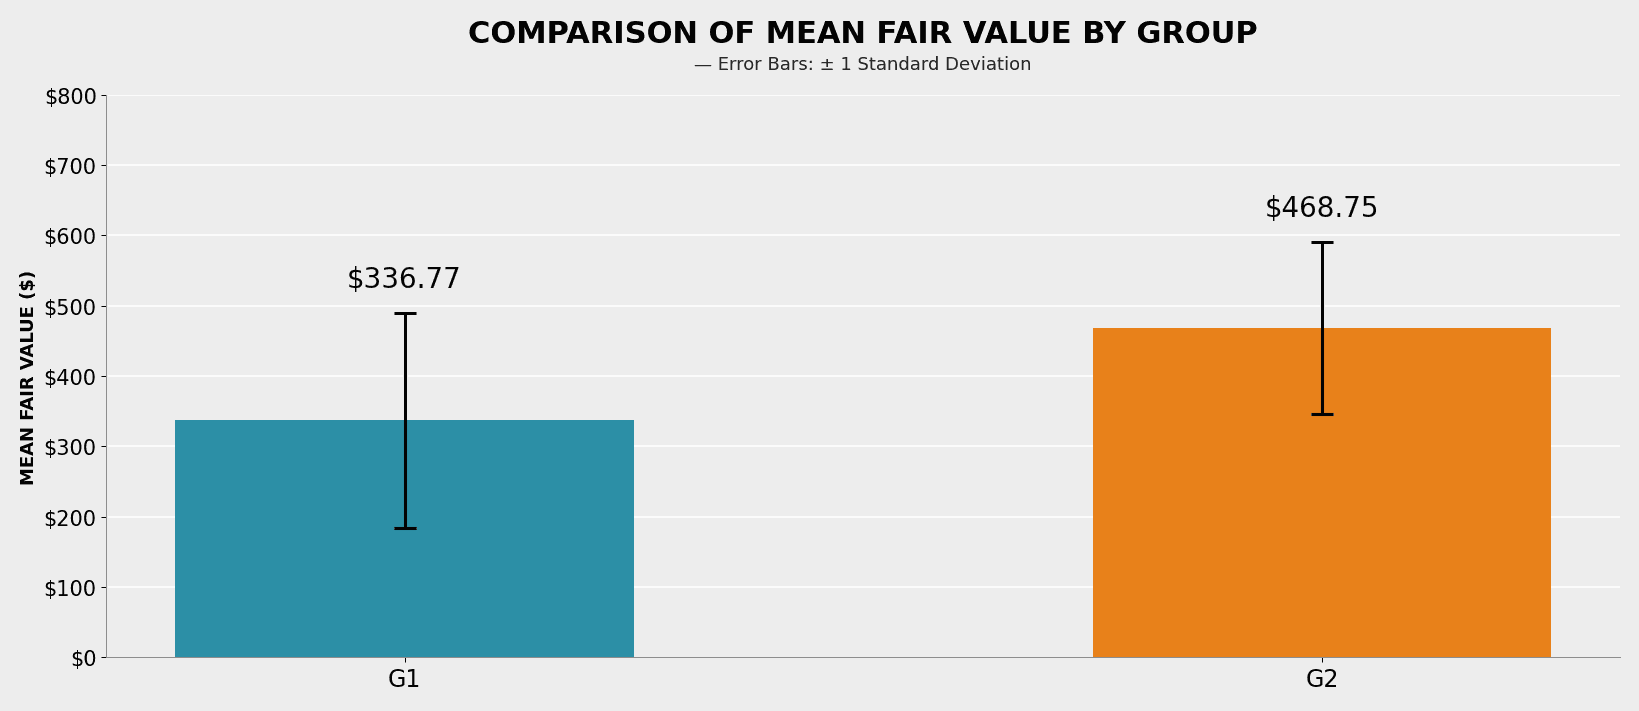
Mean fair value by group · error bars show ±1 SD
Practicality: Cohen's d
0.953
Cohen's d = 0.953 indicates a large effect by convention (small = 0.2, medium = 0.5, large = 0.8). The anchor price had a strong, practically meaningful influence, not just a statistically detectable one.
Confidence Interval
($45.93, $218.03)
A 95% confidence interval for the difference in mean fair value estimates (G2 minus G1) was calculated as ($45.93, $218.03). This means we are 95% confident that the true difference in mean fair value estimates between the high-anchor and low-anchor groups falls between $45.93 and $218.03.
Discussion
My findings support the hypothesis. The group shown the $250 anchor reported a mean fair value of $336.77, while the group shown the $525 anchor reported a mean fair value of $468.75. The price David set carries no objective information about the camera's true market value, yet we found significant evidence that people used it as a reference point when forming their estimate. This is the anchoring heuristic in action.
Limitations
Click each to expand.
Future Directions
My sample size needs to be substantially larger, ideally upwards of 100 participants per group to improve statistical power and allow for more reliable replication.
I would also add a control group shown no anchor at all, establishing a true baseline.
Other directions include measuring participants' familiarity with cameras to test whether the anchoring effect varies by knowledge level.
Using multiple anchors spaced at equal intervals to model whether the relationship between anchor price and fair value estimate is linear.
Testing whether a precise anchor like $289 moves estimates more than a round one like $250.
Examining whether anchor source credibility matters by comparing David's stated price against a professional appraiser's valuation.
Experiment #1 · June 2026